Assumptions for 2018 Tour Season: Part 2 – State Tax

The calculations throughout the 2018 golf season will first deduct federal taxes, as discussed in Part 1. Our next deduction of take-home pay will be the dollars that each professional golfer will be charged in individual income tax by the state where a tournament is held.

While each of our 50 states are proportionally represented based on population in our branches of government, there is wide disparity when it comes to state income tax.

States Without Any Individual State Income Tax

These states will have a higher Earning Power Index (more on this in a future post). The states include:

  • Alaska
  • Florida
  • Nevada
  • New Hampshire*
  • South Dakota
  • Tennessee*
  • Texas
  • Washington
  • Wyoming

*These jurisdictions charge state income tax on interest and dividend income only, and NOT income from wages. So, for the sake of calculating a professional golfer’s take home pay, New Hampshire and Tennessee.

States with a Flat Individual State Income Tax, & Personal Exemption

Although it was not mentioned in Part 1, it is likely that all calculations for these professional golfers will assume that they will file a tax return individually and not as a married couple. This is done mostly for feasibility purposes for the site.

Also, it may be easier for a professional golfer to individually file tax returns in every jurisdiction that he or she plays without involving any spousal income that could be included in a joint return.

Screen Shot 2018-01-31 at 7.10.08 PM


States with Different State Income Tax Rate based on Income

There will be further analysis related to which tournament is best to win based on the state that is hosting it.

Screen Shot 2018-01-31 at 7.22.03 PM


2016 BMW Championship Final Prize Money Breakdown with Ties and Relevant Indiana State Income Taxes

Congrats to Dustin Johnson on his great Dub at Crooked Stick.

Screen Shot 2016-09-12 at 8.51.35 PM.png

Screen Shot 2016-09-12 at 8.51.58 PM.png

Screen Shot 2016-09-12 at 8.52.20 PM.png

Screen Shot 2016-09-12 at 8.52.38 PM.png

2016 Deutsche Bank Championship – Final Prize Money with Ties & Mass. Tax Implications

Congrats to Rory McIlroy on his impressive Monday round and Deutsche Bank Championship.


Screen Shot 2016-09-06 at 9.09.56 PM.png

Screen Shot 2016-09-06 at 9.10.15 PM.png

Screen Shot 2016-09-06 at 9.10.35 PM.png

Screen Shot 2016-09-06 at 9.10.53 PM.png

2016 Deutsche Bank Championship Prize Money & Mass. Tax Implications

As another reminder: I am fully aware of the additional state and federal taxes along with possible business deductions associated with each round.

Last week I tried to incorporate federal taxes into the fold, but it was not accurate. I’ll keep these insights and data points relevant only to the state income tax for each week’s prize money as determined by the purse distribution percentage.

This week’s Deutsche Bank Championship takes the PGA Tour back to the Boston area.

# of Players in the Field: 97

Total Purse: $8,500,000

Amount to Winner (after state income taxes): $1,452,194


db1

db2.PNG

db3.PNG


UPDATED: 2016 The Barclays – Final Purse Distribution with Ties, N.Y. State Income Tax & Federal Tax Implications

Congratulations to Patrick Reed on his victory at Bethpage Black and his 7.35% state income tax tag.

bff1.PNG

bff2.PNG

bff3.PNG

2016 The Barclays Prize Money Distribution and N.Y. Income Tax Implications

The FedEx Cup Playoffs begin today at historic Bethpage Black in Farmingdale, New York. That location and zip code have been used to calculate the state income tax associated with each finishing place for this $8.5 million purse.

I still used a standard cut to 70 players, even though I’m quite sure this cut (and all future cuts remaining for this year) and treated differently due to the arduous rules of the FedEx Cup Playoffs.

# of Players in the Field: 125


Amount to Winner (after taxes): $1,417,604.00


Purse Breakdown:

b1

b2

b3


2016 Wyndham Championship Prize Money with

# of Players in Field: 156

Amount to Winner (After Taxes): $950,471.00

Purse Breakdown if Exactly Half the Field (73) Makes the Cut:

Screen Shot 2016-08-20 at 9.42.44 AM

Screen Shot 2016-08-20 at 9.43.06 AM

Screen Shot 2016-08-20 at 9.43.32 AM

Screen Shot 2016-08-20 at 9.43.48 AM

Thoughts:

Those Tax Rates – Great Scott!

I watched Back to the Future for the fist time last night. I thought it was not funny and pretty dumb. Maybe it deserves a second viewing.

These North Carolina income tax rates are not funny as well. Golfers finishing first through 23rd this weekend are going to get hit with a tax bill north of 5%.

For the sake of recency, if we were to compare the Wyndham Championship to the John Deere Classic, there are some eye-popping differences.

First, the John Deere Classic’s total purse is 15% less than the Wyndham. While $800,000 more is available this weekend, top 3 finishers this week are only netting a smidge more than the guys who did great last week in Illinois. If we eliminate the Winner’s share, mostly because the percentage he takes home relative to the entire purse is so much larger than every other golfer, we see how much these income taxes are affecting take-home pay:

  • 2nd place: $71,594 difference
  • 3rd place: $45,094 difference
  • 4th place: $31, 934 difference


A Precipitous Tax Rate Dip below $25k

With the natural tax regression occurring throughout the data, the tax rates start to plunge when a golfer’s prize money nears $25,000. We see drops of 8, 9, 9, 11, 12, and 14 percentage points respectfully for the golfers that will finish between 39th and 45th.

2016 John Deere Classic Final Prize Money Breakdown, Ties & IL Tax Reductions

With more unfamiliar names than usual to compile this weekend, here’s the dollar breakdown incorporating from the great John Deere Classic in Silvis, Illinois.

Screen Shot 2016-08-14 at 11.06.55 PM

Screen Shot 2016-08-14 at 11.07.10 PM

Screen Shot 2016-08-14 at 11.07.25 PM

Thoughts:

What is going on with 2nd Place’s Tax Rate?

I honestly have no clue. It’s the second time I’ve run these numbers using multiple sources online. The only thing I can think of is that $514,800 is near the lowest amount of dollars made in that specific tax bracket, but it should still be marginal in terms of every other bracket for all other associated dollars.

Again, I reverse engineered the actual tax rate percentage based off the annual state income tax reduction I receive when inputting the gross amount of dollars made based on the purse distribution and ties.

Pretty strange, but hopefully some rationale will surface soon.


Just 13 Golfers Netting > $100,000

From my records, this seems like the lowest amount of $100,000+ post-tax winners since the Canadian Open. Remember – that tournament needed du Toit finishing tied for 12th just to push some of that prize money down to those golfers that were not amateurs.

This is somewhat surprising given the small Illinois state income tax rates. However, even before golfers embarked on the Quad Cities area, the money pie was just not that big. It’s tough to divide 4,800,000 between 70 golfers, and that’s not taking into consideration guys who tie for 70th place and make the cut as well as ties that naturally depletes an individual’s prize money.


55% of the Field with a Tax Bill under $1,000

Regardless of the total dollars taken home, 40 total golfers had a state income tax hit of less than $1,000. Those tied for 34th had a fairly successful weekend in monetary terms, taking home a little more than $23,000 with a $828 state income tax bill.

From the 1st place golfer to the 61st place golfer, the tax rate on a golfer’s winnings started with the number 3, which is pretty interesting. For being quite blue politically, Illinois takes care of all with their relatively low state income tax rates, especially for those that put a bit more in their pocket.

2016 Olympics Golf – Players Ranked by Avg. $ Made Per Year

There are a plethora of ways to dissect these Olympic golfers and the dollars they’ve made throughout their careers to provide further context.

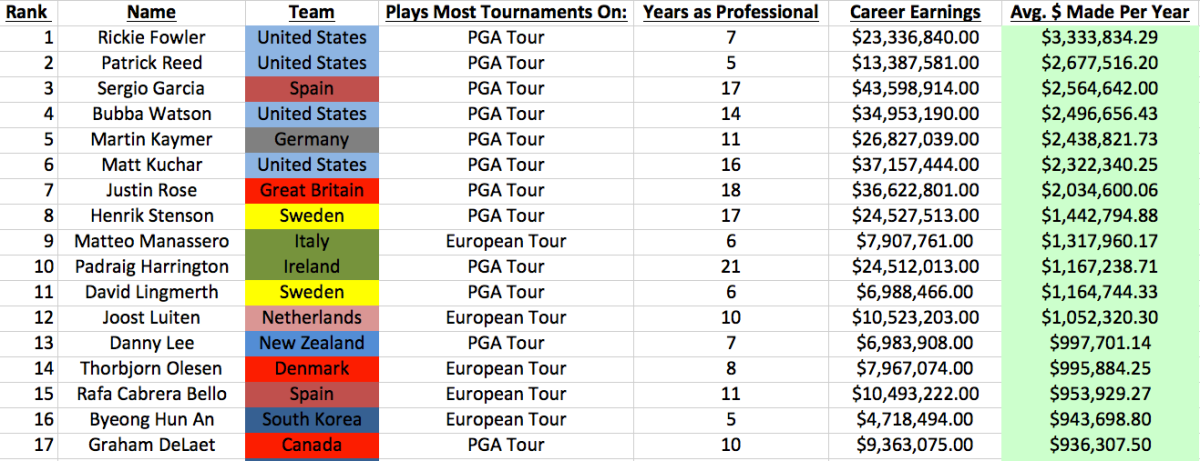
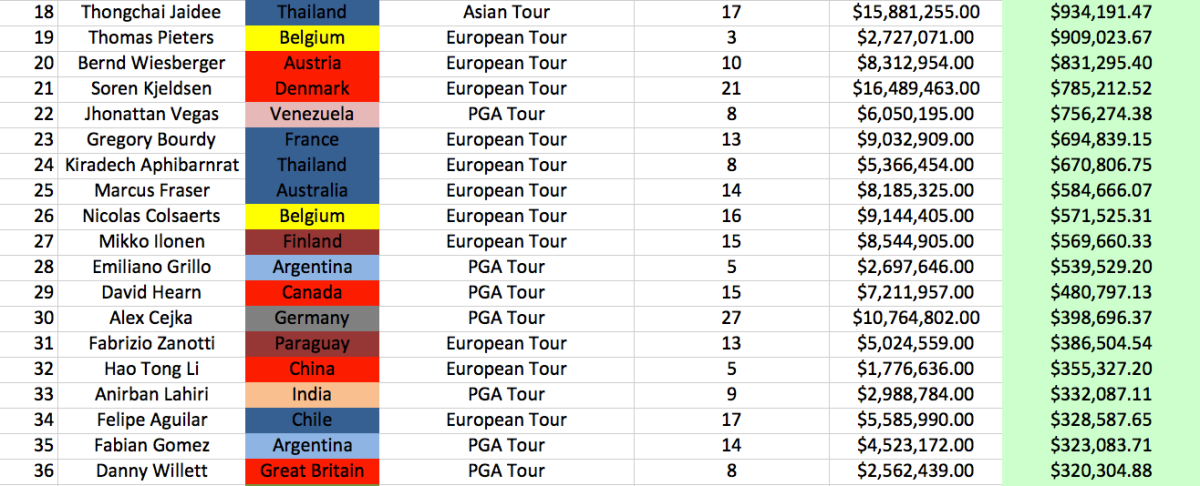
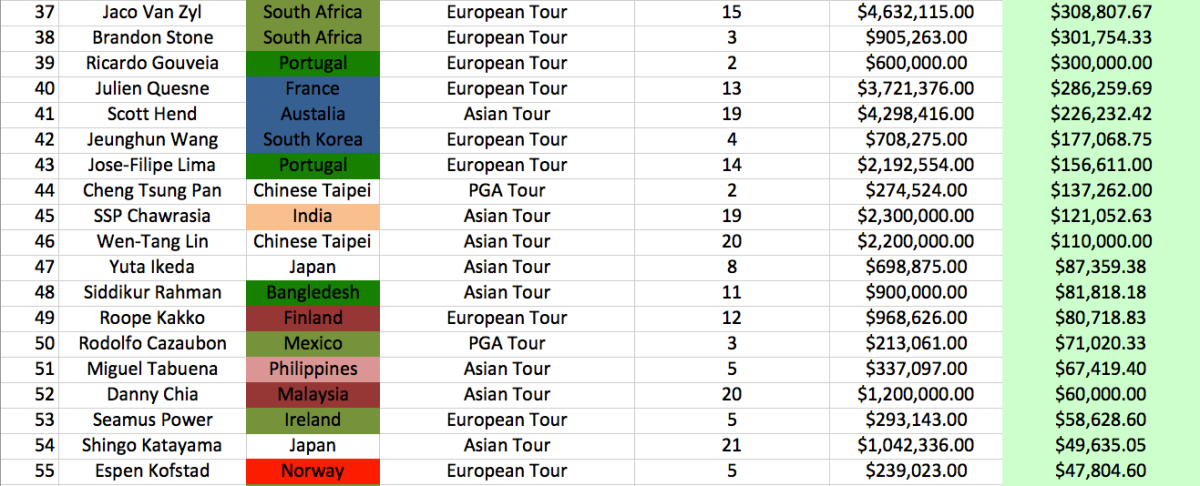
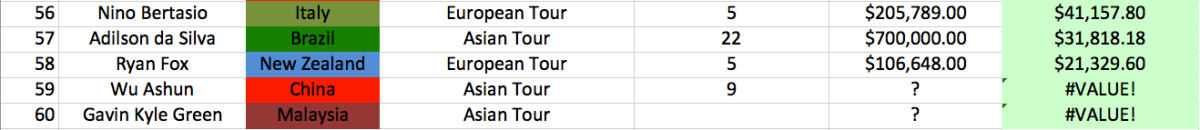
Below is a breakdown of each player, the amount of years they’ve been a Pro, their career earnings, and determining on average how much they’ve made per year as a professional.

Screen Shot 2016-08-13 at 10.05.19 PM

Screen Shot 2016-08-13 at 10.05.45 PM

Screen Shot 2016-08-13 at 10.06.13 PM

Screen Shot 2016-08-13 at 10.06.30 PM

Thoughts:

Top 2 Golfers = Americans w/ Under 10 Yrs Experience

I’ll provide the necessary caveat(s) later, but Rickie Fowler and Patrick Reed have had tremendous success early in their career. In turn, that provides plenty of dollar bills in their pockets. At 27 and 26 years of age respectively, these two have consistently played at a high level.

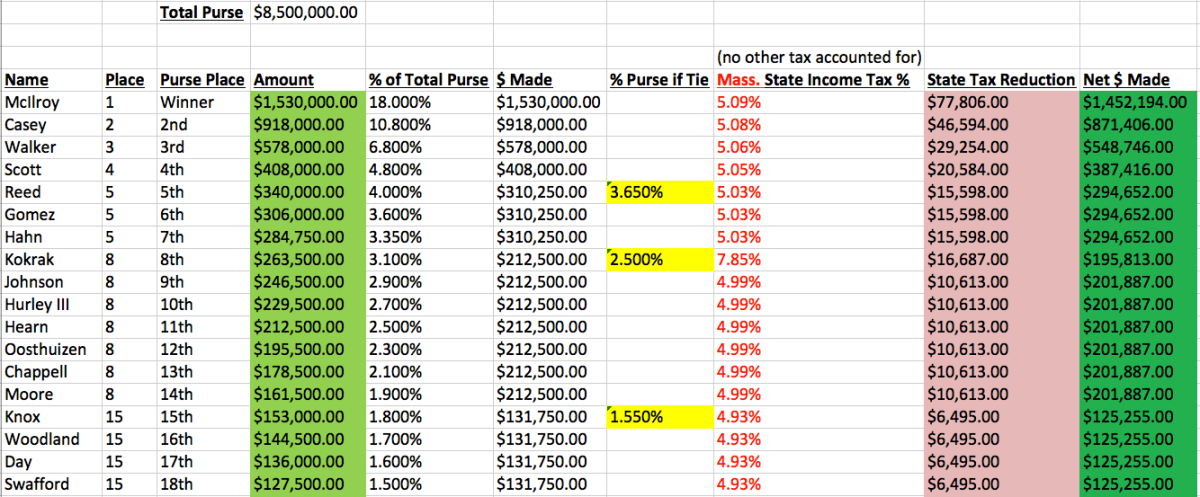
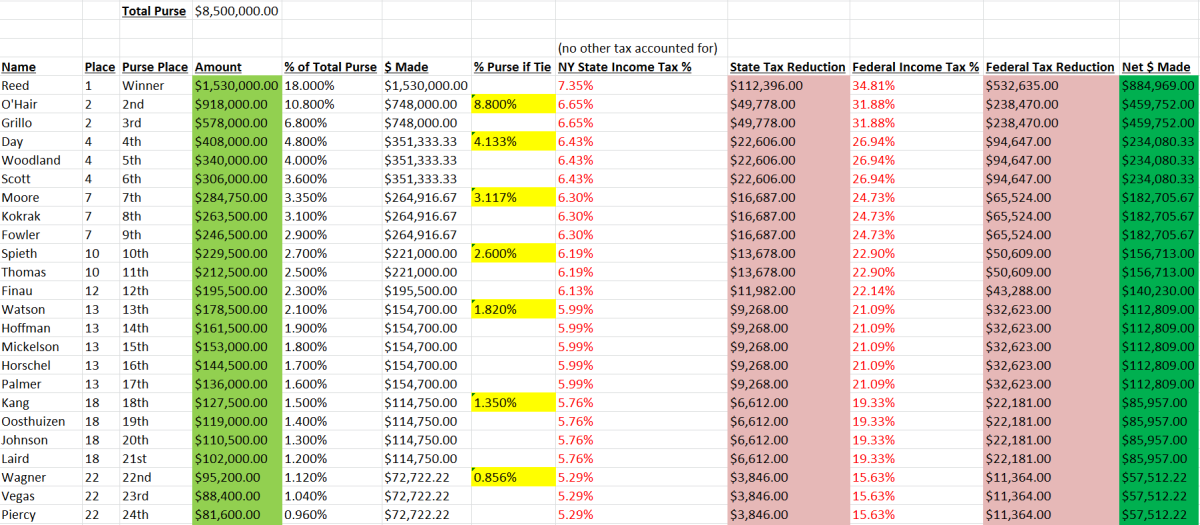
They’ve also placed very high in large purse events. Fowler won the 2015 Players Championship, bringing home $1,800,000 pre-tax. Reed won the 2014 WGC Cadillac Championship and won $1,530,000 pre-tax.


The Impact of Larger Purses Based on Time and Which Tour

And now, onto the caveats. It’s no secret that golf has become a big business in the last 5-6 years. The total purse for the U.S. Open was $10,000,000 and $10,500,000 for the PGA Championship. There are loads of money to be made playing professional golf.

Furthermore, a majority of that large capital is housed within the PGA Tour. The PGA and/or USGA has two major revenue streams that keep growing: corporate sponsorship dollars that underwrite the large events, and television rights that have continued to skyrocket and put more capital into a golf association’s coffers.

The PGA Tour has not been shy about trying to increase its bottom line. It will not host an event at Trump Doral next year, not for political purposes but because of the dollars available from a corporate sponsor to take the event to Mexico City.

While the PGA Tour is the cream of the crop in terms of total purse amounts and its quality of players, there seems to be a trickle down effect to other tours.

The European Tour has two players participating the Olympics that have been playing for less than 10 years but are in the Top 15 in average dollars made per year.

Ranked 6th on my list, Matteo Manassero has been playing golf professionally for 6 years and bringing in a cool $1.3 million per year on average. Thorbjorn Olesen has also had major success in his 8 years predominantly on the European Tour.


Playing Golf for Your Career is very Lucrative

I’d say that 27 years in one career is a large enough sample size to see how one can fare playing professional golf.

Like most professional athletes, the sample size of those playing golf for a living compared to the world population is microscopic.

Unlike most professional sports, professional golfers do not receive guaranteed money (outside of non-competition money like sponsorships and advertisements). They must compete every week and earn each dollar based on their performance. A baseball player can go 0-5 with 4 strikeouts, and he’ll still be paid regardless of his performance. A professional golfer shoots 9 over and misses the cut, and he heads home with $0 in earnings.

That’s why Alex Cejka’s is a great illustration that being a professional golfer kicks butt. 27 years playing and a shade under $11 million total made on Tour. That comes to about $400,000 pre-tax dollars made each year.

That’s a nice way to live.


2016 John Deere Classic Prize Money Breakdown & IL Tax Reductions

# of Players in Field: 156

Amount to Winner (post-Tax, if no tie): $831,681.00

Dollar Breakdown if Exactly 70 Golfers Make the Cut:

Screen Shot 2016-08-11 at 7.50.17 AM

Screen Shot 2016-08-11 at 7.50.32 AM

Screen Shot 2016-08-11 at 7.50.49 AM

Screen Shot 2016-08-11 at 7.51.02 AM